Bloomberg reports an important insight gleaned from the minutes of the Federal Reserve’s September policy meeting: “Tucked within 12 dense pages describing the Fed’s September policy meeting last week was a statement concerning a seemingly innocuous yet vital estimate that the staff use as a building block for internal economic forecasts. Their gauge of US potential output was ‘revised down significantly,’ the minutes showed, due to disappointing productivity growth and slow gains in labor force participation.”
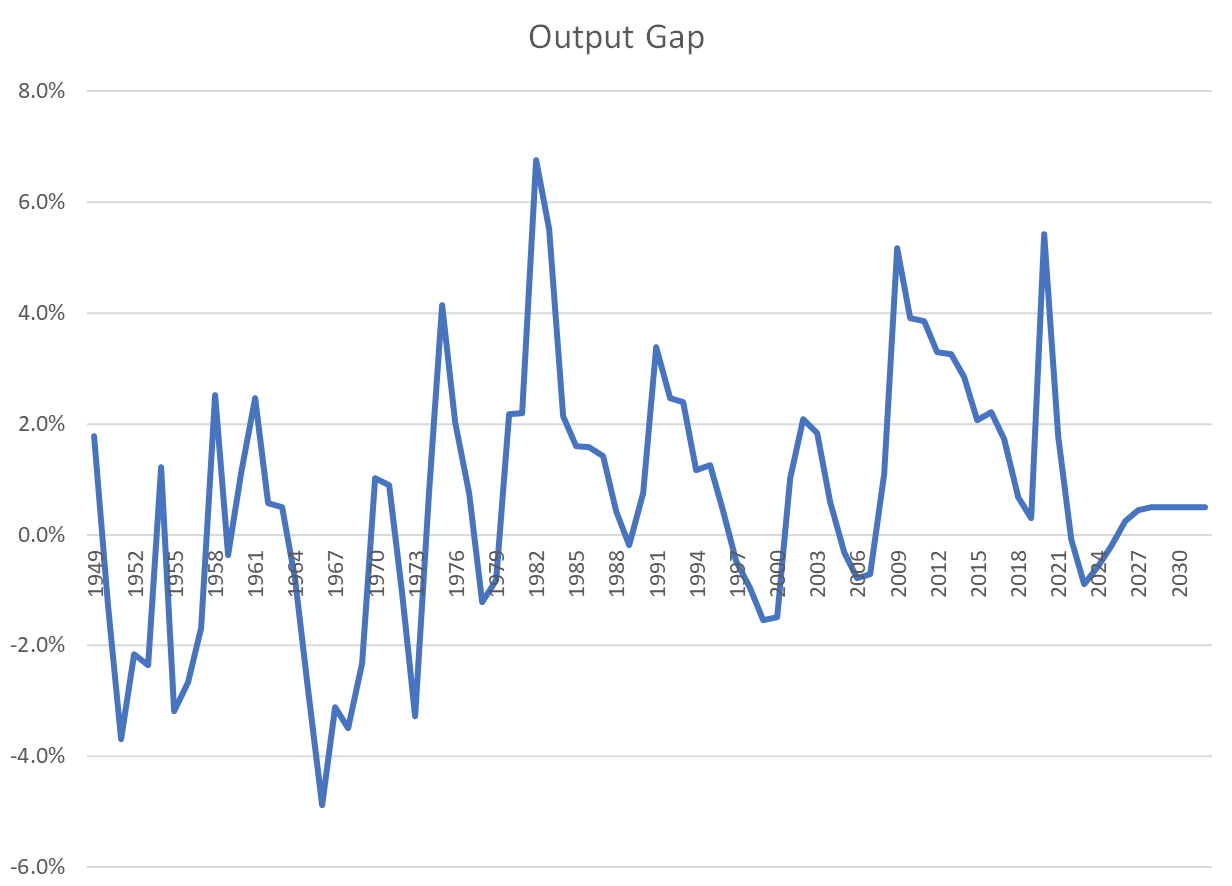
This is quietly a very big deal. At issue is the size of the “output gap” – the gap between the actual production (gross domestic product or GDP) and the potential to produce (potential GDP). The output gap (measured as a percent of potential GDP) as estimated by the Congressional Budget Office (CBO) is shown below.
Notably, the output gap can be negative (actual GDP exceeding potential GDP), as it was from 1964 to 1970. This overstimulated economy spawned the inflation of the 1970s and 1980s that was ultimately arrested by the deep recession in the early 1980s (where the output gap exceeded 6 percent).
More recently, the pandemic recession drove the output gap above 5.5 percent. CBO projects that the gap will go negative as part of the recovery before settling down to about 0.5 percent over the near term.
The Federal Reserve uses an internal version of this same framework in its policy analysis. In a nutshell, it is really important to be able to distinguish between being in the late 1960s and being in 1983. No problem. But when GDP and potential GDP are closer together, the magnitudes begin to matter. The concern is that the staff had overestimated potential GDP and the output gap, and understated the degree of inflation pressure in the economy.
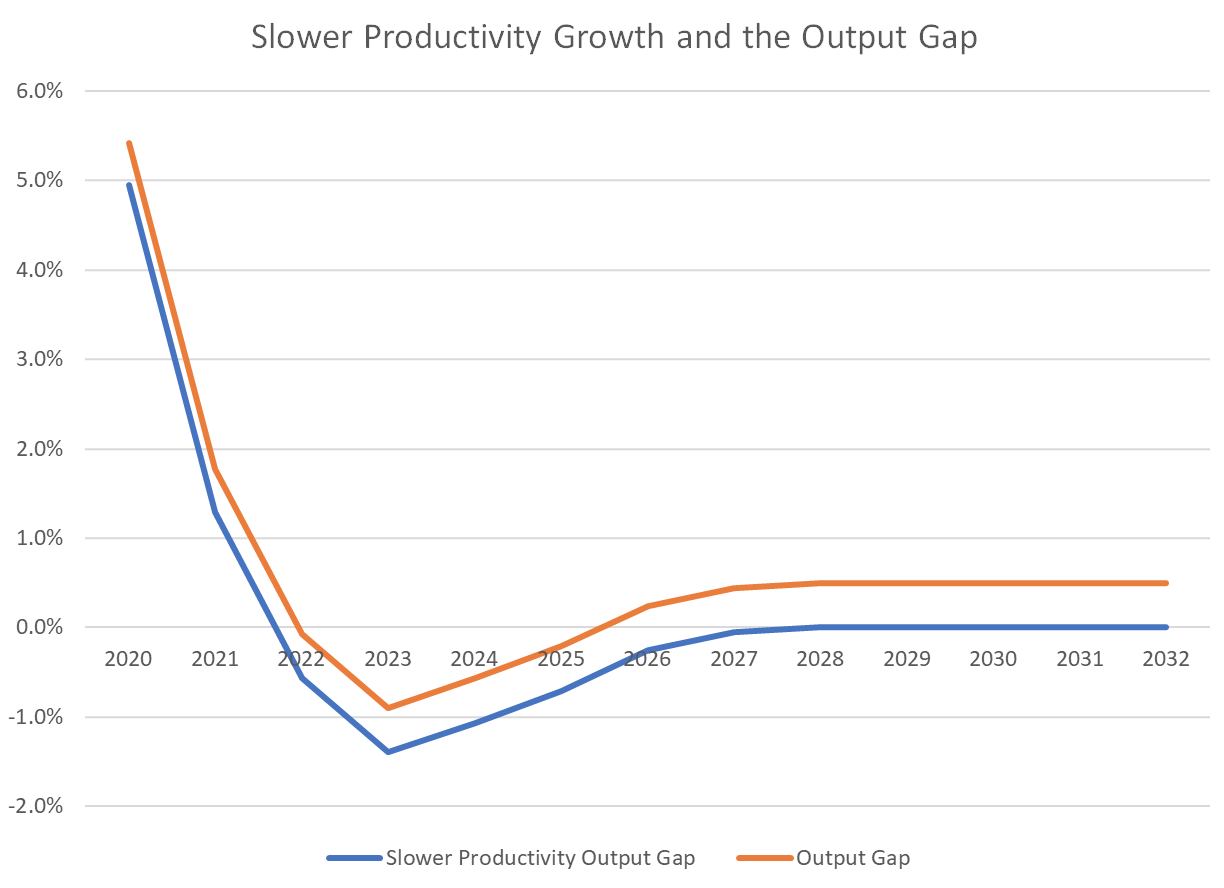
These implications are spelled out below, where the orange line replicates the CBO baseline output gap. In the blue line, however, the growth of potential GDP is slower (beginning in 2020) by half a percentage point per year. This is attributed to productivity growth, but actually could be due to any source of effective labor supply.
The implications are clear. In this example, 2022 is no longer a year of rough balance; the economy is overheating substantially and will continue to do so for another five years. From a monetary policy perspective, this kind of pattern would explain surprisingly high and stubborn inflation and would argue for higher interest rates over a longer time period to get back to the 2 percent target.
The size of the output gap does not dictate Fed decisions. But a small revision can have big implications for the path of inflation, output, and Fed policy.
The Link LonkOctober 20, 2022 at 06:08PM
https://www.americanactionforum.org/daily-dish/the-little-things/
The Little Things - AAF - American Action Forum
https://news.google.com/search?q=little&hl=en-US&gl=US&ceid=US:en


No comments:
Post a Comment